Billable utilisation is the single number that connects your team’s time to your revenue. If it slips by a few points, every pricing calculation you have done is out, and the margin you planned on disappears quietly over a quarter.
This guide explains how to measure it, the difference between utilisation and the billable % on a timesheet, how to set realistic targets, and how to lift it without burning people out.
The quick answer
Billable utilisation = billable hours ÷ available hours × 100
Available hours are the hours someone could work in the period: their contracted hours, less leave and public holidays. If a person had 168 available hours in a month and logged 118.5 billable hours, their billable utilisation is 118.5 ÷ 168 = 70.5%.
Utilisation vs billable %: they are not the same
Most timesheet reports show billable %: billable hours as a share of the hours that were logged. Utilisation compares billable hours with the hours that were available. The gap between the two is time that was never logged at all.
| Formula | Example | |
|---|---|---|
| Billable % | Billable hours ÷ total hours logged | 118.5 ÷ 149.5 = 79.3% |
| Billable utilisation | Billable hours ÷ available hours | 118.5 ÷ 168 = 70.5% |
In this example, 18.5 hours in the month were not logged anywhere. That might be leave you have not taken out of available hours, or it might be time that simply was not recorded. Either way, it is worth knowing, because unlogged time cannot be billed.
How to measure it, step by step
1. Work out available hours
Start with contracted hours for the period, then take out annual leave, sick leave and public holidays. A full-time person on 40 hours a week in a 21-working-day month has 168 available hours. If they took two days of leave, they had 152.
2. Log every hour, billable or not
Utilisation only works if all time is logged, including internal meetings, admin, sales and training. Mark each entry as billable or non-billable. Time that is not logged makes utilisation look lower than it really is and hides where the hours go.
3. Total billable and non-billable hours per person
Run a report of time logged in the period, split by billable status and grouped by person.
4. Divide billable hours by available hours
Do it per person, then for the whole team. Team utilisation is total billable hours ÷ total available hours, not the average of everyone’s percentages.
5. Track the trend, not just the month
One month can be skewed by leave, a big pitch or a quiet patch. Look at a rolling three months to see whether utilisation is really moving.
A worked example: one month, six people
Six full-time staff, each with 168 available hours in the month:
| Person | Billable hours | Billable % | Utilisation |
|---|---|---|---|
| Tom | 132.75 | 87.3% | 79.0% |
| Grace | 124.25 | 84.5% | 74.0% |
| Amelia | 118.5 | 79.3% | 70.5% |
| Nina | 109 | 73.9% | 64.9% |
| Ben | 96 | 64.6% | 57.1% |
| Leo | 71.5 | 49.1% | 42.6% |
| Team | 652 | 73.3% | 64.7% |
The timesheet says the team is 73% billable. Measured against available hours, it is under 65%. If your charge-out rates were set assuming 75% utilisation, this team is about 10 points short, and the gap comes straight out of margin. See how to calculate your charge-out rate for why the billable % you assume matters so much.
The spread matters too. Leo at 43% may be new, may be carrying a lot of internal work, or may need more project work assigned. Tom at 79% may be close to over-allocated. Both are conversations worth having.
Setting realistic targets
There is no single right number, but targets should depend on the role:
| Role | Typical target |
|---|---|
| Delivery staff (designers, developers, consultants) | 70% to 85% |
| Team leads and senior staff | 50% to 70% |
| Managers and directors | 20% to 50% |
| Operations, admin and sales | 0% to 20% |
Treat these as starting points and set your own from a few months of real data. Targets above about 85% for delivery staff usually mean people are working extra hours or not logging internal time, and they leave no room for training or slack when projects run over.
Why a few points matter
For one person with 168 available hours a month, each percentage point of utilisation is about 1.7 billable hours. At a charge-out rate of $150, that is roughly $250 a month, or about $3,000 a year. Across a team of ten, moving utilisation from 65% to 70% is worth around $150,000 a year in billable time, without hiring anyone.
How to lift utilisation
- Fix logging first. Often utilisation is better than it looks; the time just is not recorded. Ask for daily timesheets, not weekly ones from memory.
- Look at non-billable time by type. Meetings, internal projects and rework are the usual culprits. Cut the ones that do not add value.
- Balance the load. Low utilisation on one person and over-allocation on another means work is in the wrong place. See how to stop over-allocating your team.
- Bill for what you do. Scope changes and extra rounds of revisions done for free show up as non-billable time. Raise a variation instead.
- Plan the pipeline. Gaps between projects are the biggest drain on utilisation. Line up the next piece of work before the current one finishes.
Measure billable time in ProWorkflow
In ProWorkflow, every time entry is logged against a project task and marked as billable or non-billable. The Time Spent by Billable Status report in the Report Library shows billable, non-billable, invoiced and total time for any period, with a billable % column. Group it by staff to see each person side by side, or by client or project to see where the non-billable time goes.
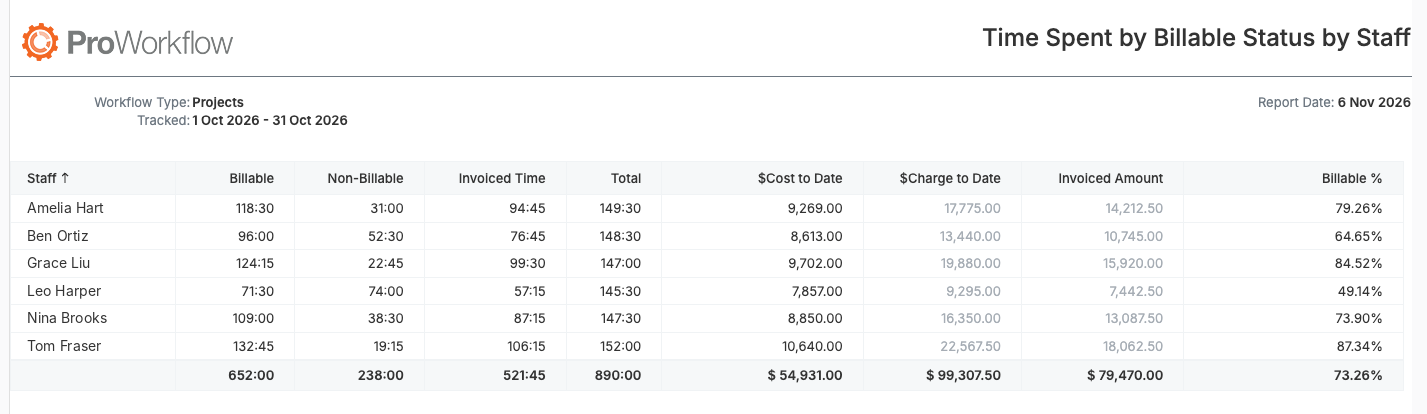
The billable % in the report is billable time as a share of time logged. Divide each person’s billable hours by their available hours for the period to get utilisation. The report also shows cost to date, charge to date and invoiced amount, so you can see what that time was worth and how much of it has been billed. Export it to PDF or Excel to share with your team.
FAQ
What is a good billable utilisation rate?
For delivery staff, many agencies and consultancies aim for somewhere between 70% and 85%. Senior staff and managers are usually lower because more of their time goes into management, sales and client relationships.
What is the difference between utilisation and billable %?
Utilisation compares billable hours with available hours. Billable % compares billable hours with the hours that were logged. Billable % is always the same or higher, and the gap shows how much time was not logged.
Should non-billable time be logged?
Yes. Without it you cannot see where the rest of the week goes, and utilisation figures are guesswork.
How often should I measure utilisation?
Monthly per person, with a rolling three-month view to smooth out leave and one-off spikes. This is where a project management tool like ProWorkflow helps: every hour is logged against a project and marked billable or not, so your utilisation numbers come from real timesheet data rather than assumptions.