Most agencies have plenty of data. Every hour is logged, every invoice is in the system, every quote has a status. What is usually missing is the habit of looking at it. The numbers that would have warned you about a slipping margin, a client who pays late or a designer who is booked at 120% were there all along. Nobody ran the report.
This guide covers the ten reports worth running every month, what each one tells you, what to look for, and how to set them up so they arrive in your inbox without anyone having to remember.
The quick answer
Every month, check four things: are projects making money, is the money coming in, is the team’s time going to the right work, and is next month under control. These ten reports cover all four:
| Report | The question it answers | |
|---|---|---|
| 1 | Project margin by client | Which projects and clients actually make money? |
| 2 | Budget vs actual by phase | Where do our estimates go wrong? |
| 3 | Billable utilisation | How much of the team’s time can we bill? |
| 4 | Work in progress | What have we done but not yet invoiced? |
| 5 | Unpaid invoices | Who owes us money, and for how long? |
| 6 | Revenue by client | Who are we really working for? |
| 7 | Quote win rate | How many of our quotes turn into work? |
| 8 | Team workload, next 30 days | Who is overloaded and who has room? |
| 9 | Time by person and project | Where did everyone’s hours go? |
| 10 | Overdue projects | What is late, and who owns it? |
Are projects making money?
1. Project margin by client
If you run one report a month, run this one. It lists every active project with what you planned to charge, what you expected it to cost, what it has cost so far, the profit and the margin. Grouped by client, it shows you which relationships are worth having.
In ProWorkflow: open Summary of Projects, set the grouping to Grouped by Client, and add the Estimate $, Est Cost $, Cost to Date $, Profit $ and Margin % fields.
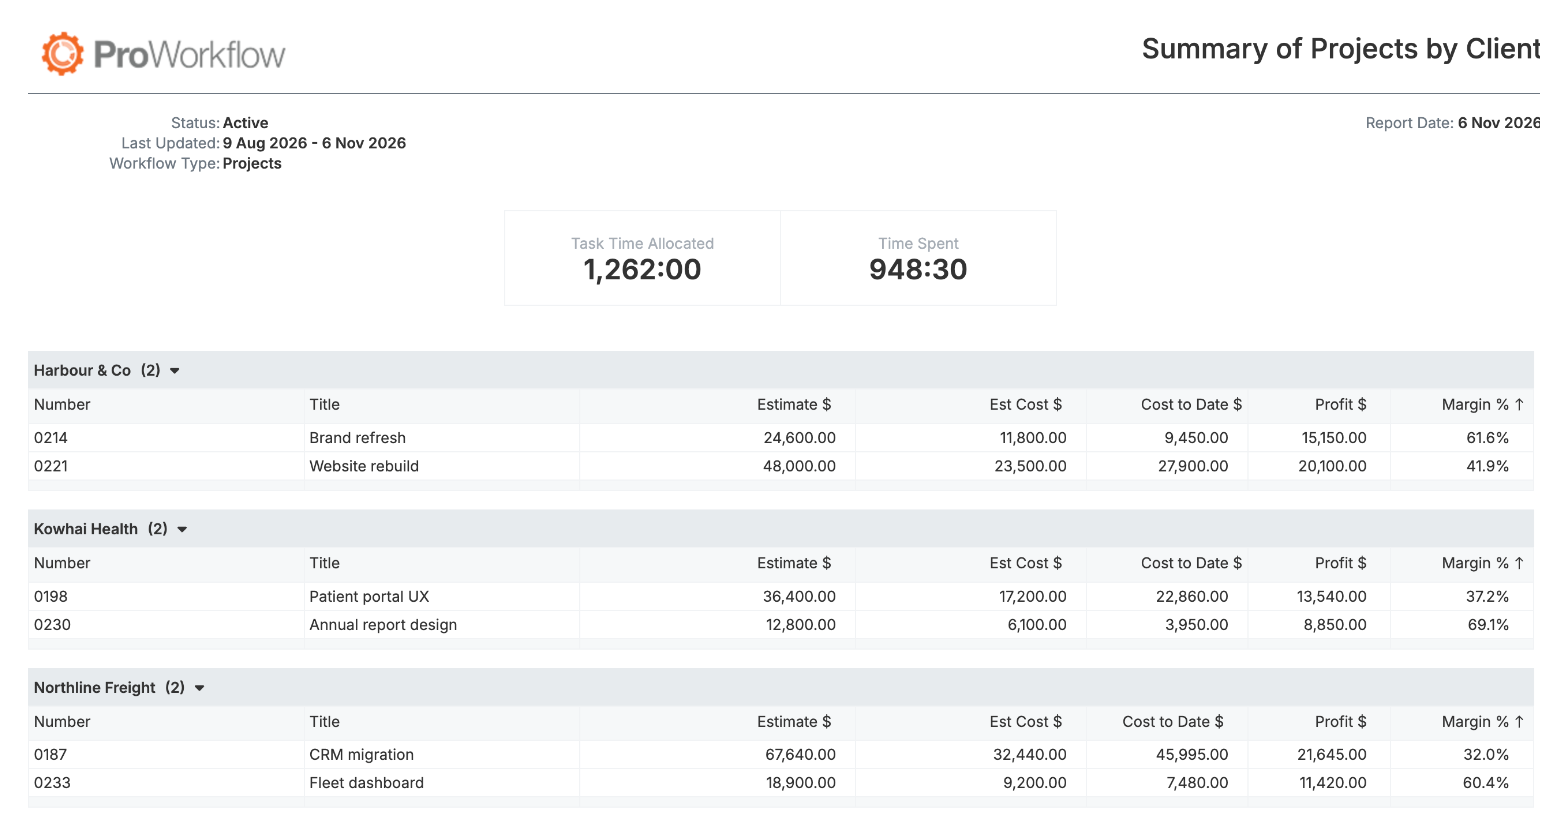
What to look for: any project where cost to date is close to, or already above, the estimated cost while work is still going on. In the example, the Northline Freight CRM migration has already cost $45,995 against a cost budget of $32,440, and its margin is down to 32%. The budget vs actual guide walks through that exact project and how to catch it earlier.
Look at the client groups too. If one client’s projects always land at a lower margin than everyone else’s, the problem is usually the scope or the price, not the team. A forecast column, Forecasted Profit $, is also available if you want to see where a project is heading rather than where it is today.
2. Budget vs actual by phase
Project totals tell you that something went wrong. Phase totals tell you where. Most agencies find the same phase runs over on project after project, usually discovery, revisions or testing.
In ProWorkflow: open Summary of Phases and add Time Allocated, Time Spent, Time Variance %, Est Cost $ and Cost to Date $.
What to look for: a phase type that is over budget on most projects. That is an estimating problem, and the fix is to change your quote template, not to push the team harder.
3. Billable utilisation
Utilisation is the share of available hours that were billable. It is the number your charge-out rates depend on, and a few points either way make a big difference to profit.
In ProWorkflow: run Time Spent by Billable Status for last month and group it by staff. It shows billable, non-billable and invoiced time for each person, with a billable % column. Divide each person’s billable hours by their available hours to get utilisation.
What to look for: people well below their target, and people well above it. Both are a conversation. The billable utilisation guide explains the formula, realistic targets by role and how to lift it.
Is the money coming in?
4. Work in progress
Work in progress (WIP) is time and materials you have delivered but not invoiced yet. It is money you have earned and are not collecting. On time-and-materials and retainer work it builds up quietly if nobody watches it.
In ProWorkflow: add Uninvoiced $ and Invoiced $ to Summary of Projects, grouped by client or by manager. For a phase-level view, Summary of Phases has a Phase WIP $ field.
What to look for: uninvoiced amounts that grow month after month on the same projects. Invoice them, or find out why they cannot be invoiced.
5. Unpaid invoices
Profit on paper does not pay wages. This report shows what each client has paid and what they still owe.
In ProWorkflow: run Invoiced by Paid Status (Overview), grouped by client. For the detail behind each figure, use Summary of Invoices with the Due, Status and Days Overdue fields.
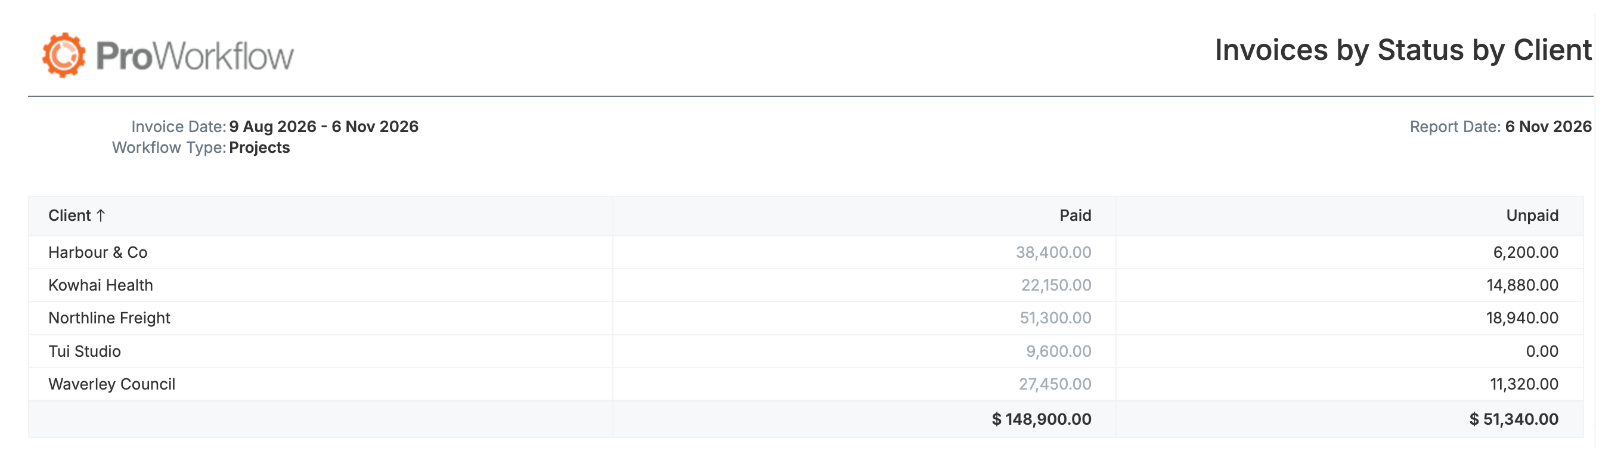
What to look for: clients whose unpaid total is large compared with what they have paid. Kowhai Health in the example owes $14,880 against $22,150 paid, which is worth a phone call. Sort the detailed report by days overdue and start at the top.
6. Revenue by client
This shows how much you invoiced each client in each month. It answers a question most owners think they know the answer to: who are we really working for?
In ProWorkflow: run Invoiced by Date Range, grouped by client, for the last six or twelve months. Each month is its own column.
What to look for: dependence on one or two clients, and clients whose spend is dropping. If a single client is a large share of revenue, losing them is a business risk, not just a sales problem.
7. Quote win rate
Your win rate tells you whether your pricing and your proposals are working. Work it out as approved quotes ÷ (approved + not approved), by value or by count.
In ProWorkflow: run Quoted by Approved Status (Overview) for the month or quarter. It shows approved, not approved and pending amounts for each client. Summary of Quotes lists each quote with its status and dates.
What to look for: a falling win rate, and pending quotes that have sat for weeks. A very high win rate is worth a look too. It can mean you are priced too low.
Is the team’s time going to the right work?
8. Team workload for the next 30 days
The other nine reports look back. This one looks ahead. It shows the hours planned for each person on each day, so you can spot overload before it turns into late nights and missed deadlines.
In ProWorkflow: run Staff Workload Overview. It defaults to the next 30 days and shows each person’s planned hours by day, plus a column of hours already overdue.
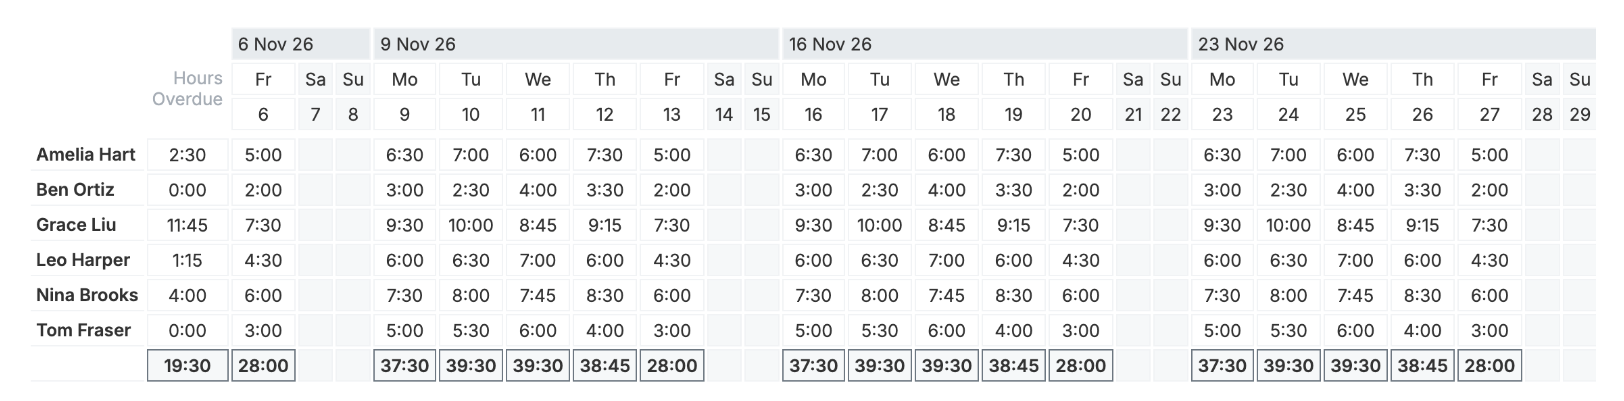
What to look for: anyone planned at more hours than they can really work in a day, and anyone with a lot of overdue hours. In the example, Grace has 9 to 10 hours planned most days and nearly 12 hours overdue, while Ben has 2 to 4 hours a day. Moving some of Grace’s work to Ben fixes both. See how to stop over-allocating your team for how to work out each person’s real capacity.
9. Time by person and project
Utilisation tells you how much time was billable. This report tells you where all of it went, project by project and person by person.
In ProWorkflow: run Time Spent by Staff Per Project for the month. It shows each person’s hours on each project. Staff Performance adds a quick per-person summary of billable hours against total hours and time tracked against time allocated.
What to look for: senior people spending lots of hours on work a junior could do, internal projects quietly eating a big share of time, and people who log much less time than they work.
10. Overdue projects
A project that is late is usually also over budget, and the client is usually already unhappy. This report puts every late project and its owner on one page.
In ProWorkflow: add Due, Days Overdue, Status and Manager to Summary of Projects, grouped by manager, and sort by days overdue.
What to look for: projects that are overdue for the same reason again and again, such as waiting on client feedback or content. That points to a process fix, like a clearer approval step at kickoff.
Make it a 30-minute habit
Ten reports sounds like a lot. Once they are set up, the monthly review takes about half an hour:
- Set each report up once. Choose the grouping, fields and filters, then Save a copy with a clear name, such as “Project margin by client”. It appears under My Reports, and you can star the ones you use most.
- Share them with the people who act on them. A saved report can be shared with other staff, so project managers see the same numbers you do.
- Schedule them. Any saved report can be emailed automatically, weekly, fortnightly, monthly or quarterly, as a PDF or Excel attachment, to staff and, if you want, to clients or contractors.
- Review them in the same order every month. Start with margin, then cash, then time, then next month. Write down two or three actions and check them off before the next review.
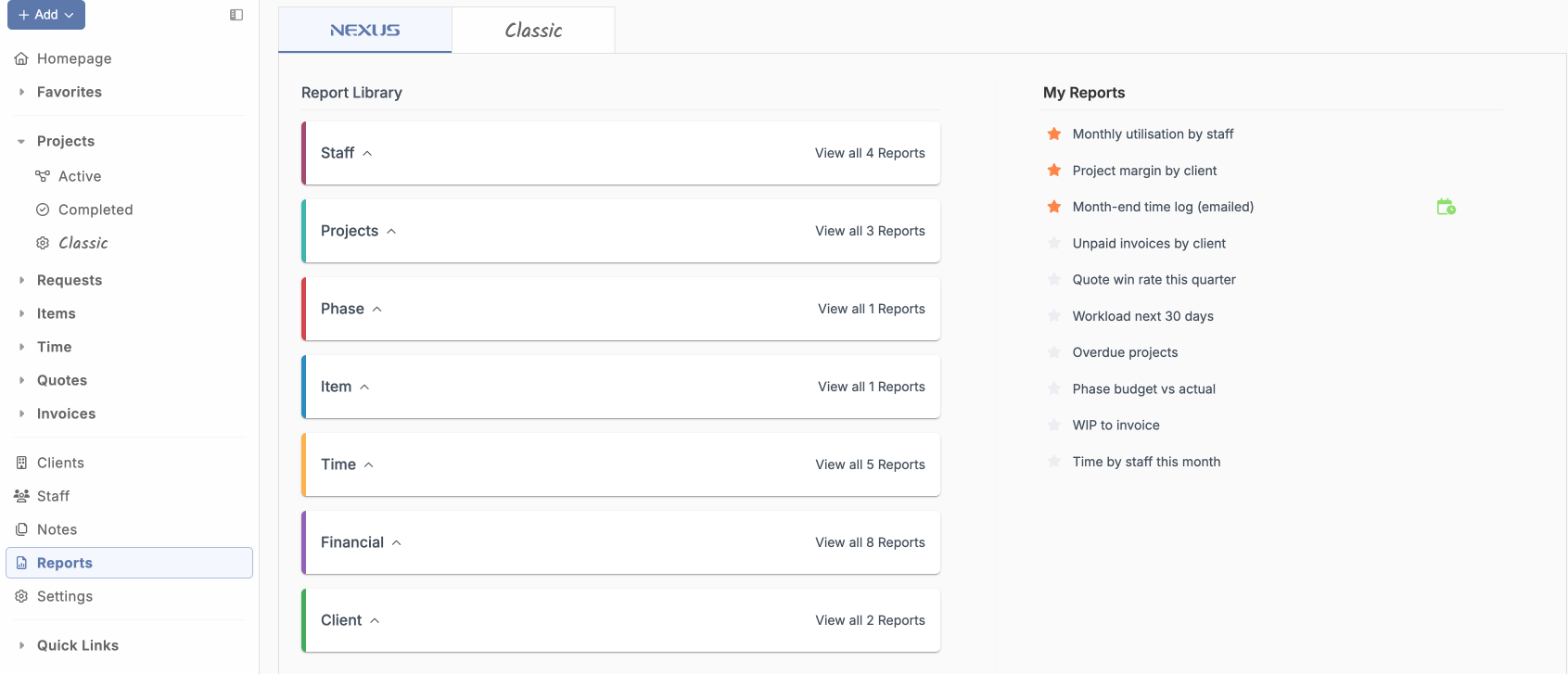
For what every report in the library shows, see the Report Library: all 24 reports explained. To set up automatic emails step by step, see Scheduling Reports.
FAQ
What reports should an agency run every month?
At minimum: project margin, budget vs actual by phase, billable utilisation, work in progress, unpaid invoices, revenue by client, quote win rate, team workload for the next month, time by person and project, and overdue projects. Together they show whether projects are profitable, whether cash is coming in and whether the team’s time is going to the right work.
What is the most important report for an agency owner?
Project margin. It combines pricing, estimating and delivery in one number. If margins are healthy and getting paid is not a problem, most other issues are fixable.
How do I calculate my quote win rate?
Divide the value (or number) of approved quotes by the value of approved plus not approved quotes for the same period. Leave pending quotes out until they are decided.
Can reports be emailed automatically?
Yes. In ProWorkflow, save a copy of the report first, then schedule it to be emailed weekly, fortnightly, monthly or quarterly as a PDF or Excel file.
How long should a monthly reporting review take?
About 30 minutes once the reports are set up, and an hour the first time. This is where a project management tool like ProWorkflow helps: time, budgets, invoices and quotes all live in one place, so every report runs on the same live data instead of spreadsheets someone has to update first.